
Let’s bring your ideas to life with expert-driven automation, dashboards, and digital solutions tailored for your business.
The client needed a solution to manage, analyze, and visualize logistics data, including cost tracking, trips, and mileages, in a way that was both automated and easy to use.
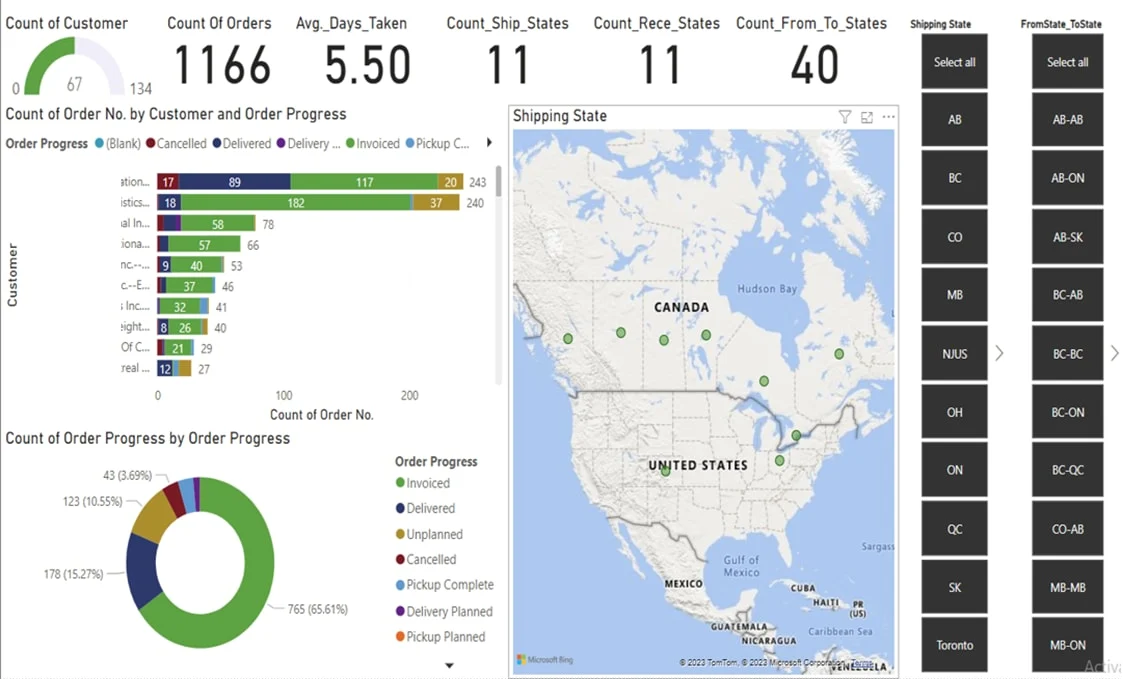
This project focused on implementing Business Intelligence solutions to streamline data management and reporting processes for a logistics company in Canada. By utilizing Google Sheets for Process Optimization and Power BI for interactive dashboards, we helped the client visualize key logistics data and drive informed decision-making.
We designed Google Sheets for data integration and analysis, which fed into interactive Power BI dashboards. These dashboards offered filters and real-time data visualizations, allowing executives to monitor daily logistics data efficiently.
These updates were automatically calculated through the formulas, giving the Canadian Logistics Company immediate, actionable insights.
The solution transformed the client’s logistics operations, providing real-time insights through interactive dashboards and improving cost tracking and decision-making. The intuitive visualizations allowed stakeholders to easily assess key performance indicators, boosting productivity.
Stay ahead of the curve with the latest insights and updates in data analysis—sign up for our newsletter today!
Expert Services | Data Analysis | Data Analytics | Data Visualization | Data Automation | Dashboards
GST : 08AKDPG9031E1ZG
UDYAM NO: UDYAM-RJ-15-0033605
Oaz Shakti Business Solutions and Technologies
2/3, First Floor, Maharaja Agrasen Vidhya Mandir School, Jawahar Nagar, Sri Ganganagar, Rajasthan, India-335001