Original price was: $14,887.50.Current price is: $5,359.50.

CEO Dashboard, Executive Dashboards, Real-Time Data Integration, Interactive Visualizations, Customizable Dashboards, Advanced Analytics for Executives, Secure Business Dashboards, Mobile-Accessible Dashboards, KPI Tracking Dashboards, Business Intelligence Dashboards

Description

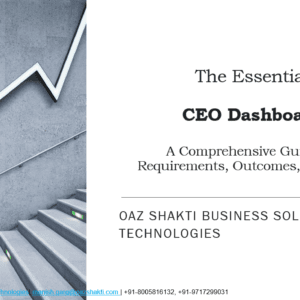
Unlock the full potential of your executive decision-making with our state-of-the-art CEO Dashboard. Designed specifically for business leaders, this powerful tool transforms complex data into clear, actionable insights, enabling you to drive your company towards greater success.

Key Features:

  • Real-Time Data Integration: Stay updated with the latest information by integrating data from various sources like ERP systems, Google Sheets, Dataverse, and more.
  • Interactive Visualizations: Visualize your KPIs, financial metrics, and operational data through dynamic and interactive charts and graphs.
  • Customizable Dashboards: Tailor the dashboard to meet your specific business needs with customizable widgets and layouts.
  • Advanced Analytics: Utilize advanced analytics and machine learning to predict trends and make informed decisions.
  • Secure and Reliable: Ensure data security with our robust encryption and reliable cloud-based solutions.
  • Mobile Accessibility: Access your dashboard on the go with full mobile compatibility.

Why Choose Our CEO Dashboard?

  • Comprehensive Overview: Get a holistic view of your business operations at a glance.
  • Actionable Insights: Transform data into actionable insights to boost your strategic planning.
  • Increased Efficiency: Streamline your workflow and save time with automated reporting and real-time updates.
  • Enhanced Decision-Making: Make informed decisions with accurate and up-to-date information.
  • User-Friendly Interface: Navigate with ease through our intuitive and user-friendly interface.

Discover the Power of Real-Time Insights!

Elevate your leadership with our CEO Dashboard and make data-driven decisions with confidence. Whether you need to monitor financial performance, track key metrics, or predict future trends, our solution provides everything you need to stay ahead in the competitive business landscape.

Additional information

CEO Dashboard By Oaz Shakti

1. Executive Summary 📈
High-Level Overview: Provides a snapshot of the organization's performance across key areas.
Key Metrics: Displays crucial metrics such as revenue, profit margins, and growth rates.
2. Customizable Widgets 🛠️
Personalized Layout: Tailor widgets to display the most relevant data for the CEO’s needs.
Drag-and-Drop Functionality: Easily rearrange components to suit personal preferences.
3. Real-Time Data ⏱️
Live Updates: Offers up-to-the-minute information to ensure decisions are based on the latest data.
Automated Data Refresh: Automatically updates data to reflect real-time changes.
4. Financial Performance 💰
Revenue and Profit Tracking: Visualize revenue streams, profit margins, and financial health.
Budget vs. Actuals: Compare budgeted figures to actual performance to identify variances.
5. KPI Tracking 📊
Critical Performance Indicators: Monitor essential KPIs relevant to business goals and strategy.
Performance Trends: Track trends over time to assess progress and identify areas for improvement.
6. Strategic Goals and Objectives 🎯
Goal Tracking: Measure progress towards strategic goals and objectives.
Milestone Achievement: Visualize completed milestones and upcoming targets.
7. Risk Management ⚠️
Risk Indicators: Identify and monitor key risks and potential issues.
Alerts and Notifications: Receive notifications for significant deviations or risks.
8. Interactive Visualizations 🔍
Dynamic Charts and Graphs: Interactive elements to drill down into data and explore detailed insights.
Data Filtering: Customize views by filtering data based on various criteria.
9. Data Integration 🔗
Multi-Source Integration: Combine data from different systems and sources into a unified view.
API Connectivity: Connect with external applications and databases for comprehensive data analysis.
10. Mobile Accessibility 📱
Responsive Design: Access the dashboard from any device, including tablets and smartphones.
Touch-Friendly: Designed for ease of use on mobile devices with touch interactions.
11. User Access and Permissions 🔐
Role-Based Access: Control who can view or edit different parts of the dashboard.
Secure Data Handling: Ensure data privacy and security with robust access controls.
12. Data Storytelling 📚
Narrative Insights: Include annotations and context to explain data trends and insights.
Visual Stories: Use charts and visuals to narrate the story behind the data effectively.
13. Forecasting and Predictions 🔮
Predictive Analytics: Utilize forecasting models to predict future trends and outcomes.
Scenario Analysis: Explore different scenarios and their potential impact on business performance.
14. Collaboration Tools 🤝
Shared Dashboards: Enable team collaboration by sharing dashboards with other stakeholders.
Commenting and Annotations: Allow team members to add comments and insights directly on the dashboard.

Reviews

There are no reviews yet.

Be the first to review “CEO Dashboard: Empower Your Executive Decisions”

Your email address will not be published. Required fields are marked *

You may also like…